

Motorway breakdowns in Britain rise by a fifth in five years
Nearly 1m vehicles have broken down since 2014
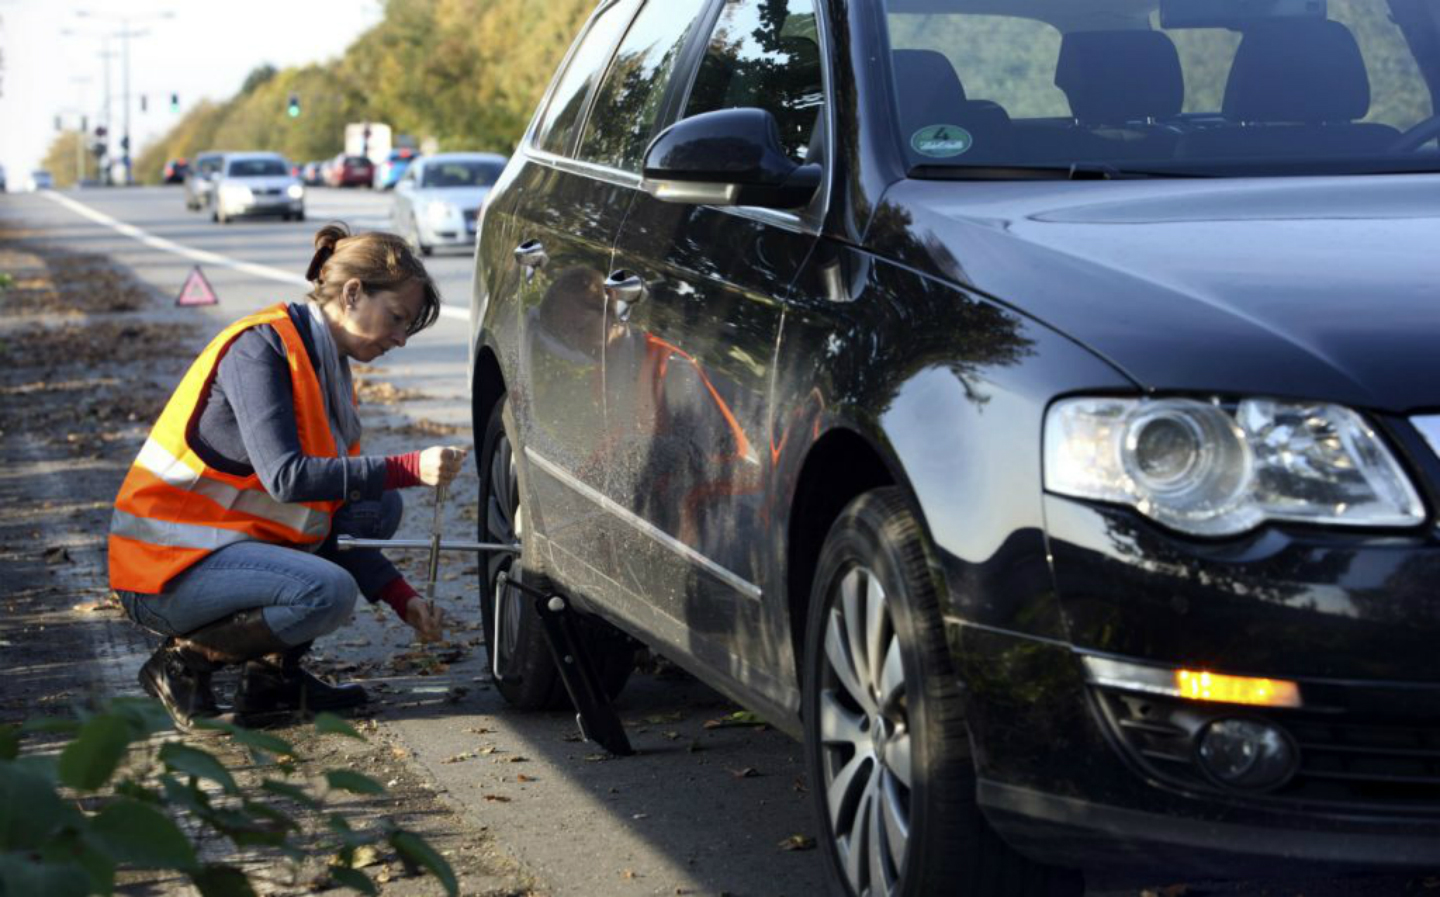
THE NUMBER of car breakdowns on UK motorways has risen by nearly 20% since 2014, according to new figures released by Highways England.
Data from the government-run company shows 224,225 cars broke down on Britain’s busiest roads between April 2018 and March 2019, which equates to around 25 vehicles every hour.
The amount of breakdowns in 2018-19 was a big increase on previous years, according to the statistics. In the same period from 2017 to 2018, 195,292 vehicles developed a fault on motorways.
The figure is more stark over five years: 189,256 drivers were forced to pull over on the hard shoulder in 2014-15 — representing a rise in the number of breakdowns of nearly a fifth (18.48%).
Of the 983,005 breakdowns that Highways England recorded over the last five years, the summer months accounted for the largest proportion, with just over a quarter (26.88%) of cases occurring in July, August and September.
In June this year, Highways England said it was expecting 50,000 vehicles to require roadside assistance on UK motorways between July and September.
In comparison, the considerably colder winter months accounted for the smallest chunk of car breakdowns, with just over a fifth (22.88%) of cars requiring rescue in January, February and March.
Highways England’s figures also show which motorways were Britain’s biggest hot spots for car failures. Leading the way was the M1 motorway, with 139,394 reported breakdowns over the last five years, comfortably ahead of the M25 (125,081) and M6 (124,852). Combined, those three major roads accounted for nearly two-fifths (39.6%) of all the vehicles that had broken down over that period.
The statistics don’t point to any reasons for the increase in breakdowns, however a rise in the average age of cars is not thought to be a factor. According to data from the Department for Transport, the average age of cars registered in Britain has remained fairly stable in recent years, with a slight rise from eight years old in 2015 to 8.2 years in 2018.
It’s also unclear if the roll-out of smart motorways (which have their hard shoulders removed to make way for another traffic lane, with emergency refuge areas at regular intervals instead) has had an impact. While 10 of the 15 motorways with the highest breakdown figures have been converted into smart motorways, traffic flow data from 2018 from the Department for Transport also indicates they’re among the busiest motorways in the county, meaning the probability of a car stopping for a serious fault is higher.
Though the numbers of vehicles needing roadside assistance on Britain’s motorways appears to have increased over the last five years, Highways England says some drivers could be doing more to reduce the chances of major failures. According to its own research, nearly half of all breakdowns are caused by “simple mechanical problems which could be avoided with simple checks”.
The top 15 major road breakdown locations in the UK
| Rating | Road name | Number of car breakdowns (April 2014 to March 2019) |
| 1 | M1 | 139,394 |
| 2 | M25 | 125,081 |
| 3 | M6 | 124,852 |
| 4 | M5 | 71,403 |
| 5 | M62 | 58,300 |
| 6 | M4 | 54,510 |
| 7 | M40 | 39,070 |
| 8 | A1M | 35,386 |
| 9 | M60 | 30,158 |
| 10 | M3 | 29,024 |
| 11 | M42 | 22,183 |
| 12 | M11 | 19,273 |
| 13 | A1M | 18,731 |
| 14 | M20 | 16,615 |
| 15 | M56 | 14,400 |
Tweet to @J_S_Allen Follow @J_S_Allen
Highways England braces for summertime surge in motorway breakdowns